Logistic regression is one of the most common and useful classification algorithms in machine learning. If you wish to become a better machine learning practitioner, you'll definitely want to familiarize yourself with logistic regression.
Let's take some time to understand how logistical regression functions and situations where it should be utilized.
Defining Machine Learning Terms
Logistic regression is a type of classification algorithm. Yet what does "classification" mean?
As a machine learning practitioner, you’ll need to know the difference between regression and classification tasks, as well as the algorithms that should be used in each.
Classification and regression tasks are both types of supervised learning, but the output variables of the two tasks are different. In a regression task, the output variable is a numerical value that exists on a continuous scale, or to put that another way the output of a regression task is an integer or a floating point value.
In contrast, in a classification task, the outputs of an algorithm fall into one of various pre-chosen categories. The classification model attempts to predict the output value when given several input variables, placing the example into the correct category.
Let’s look at an example of classification tasks and regression tasks to make sure the difference is clear.
Let’s say you have a dataset full of detail about different houses and you want to predict the price the house will sell for. In a regression task, the model takes in the features (like the number of rooms, land area, house age, etc.) and tries to predict a numerical value, like $95, 825.
Mathematically, for {x1,x2,...,xn} being the features and y being the price, let’s assume a hypothesis function 0 such that y= 0(x1,x2,...,xn). The regression model will try to draw a specific that best fit to the dataset.
In a classification task, the outputs would fall into one of a few different categories. Say for example you'd had five different categories for the price:
- Much lower than expected price
- Lower than expected price
- Approximately expected price
- Higher than expected price
- Much higher than expected price
A classification algorithm would label the example with one of the chosen categories.
What Is Logistic Regression?
Logistic regression is a classification algorithm, used when the value of the target variable is categorical in nature. Logistic regression is most commonly used when the data in question has binary output, so when it belongs to one class or another, or is either a 0 or 1.
Remember that classification tasks have discrete categories, unlike regressions tasks.
Here, by the idea of using a regression model to solve the classification problem, we rationally raise a question of whether we can draw a hypothesis function to fit to the binary dataset. For simplification, we only concern the binary classification problem with the dataset below:

The answer is that you will have to use a type of function, different from linear functions, called a logistic function, or a sigmoid function.
(Note: Here’s something important to remember: although the algorithm is called “Logistic Regression”, it is, in fact, a classification algorithm, not a regression algorithm. This can be confusing at first, but just try to remember it.)
The Sigmoid Function
The sigmoid function/logistic function is a function that resembles an “S” shaped curve when plotted on a graph. It takes values between 0 and 1 and “squishes” them towards the margins at the top and bottom, labeling them as 0 or 1.
The equation for the Sigmoid function is this:
![]()
What is the variable e in this instance? The e represents the exponential function or exponential constant, and it has a value of approximately 2.71828.
Let’s see how the sigmoid function represent the given dataset.
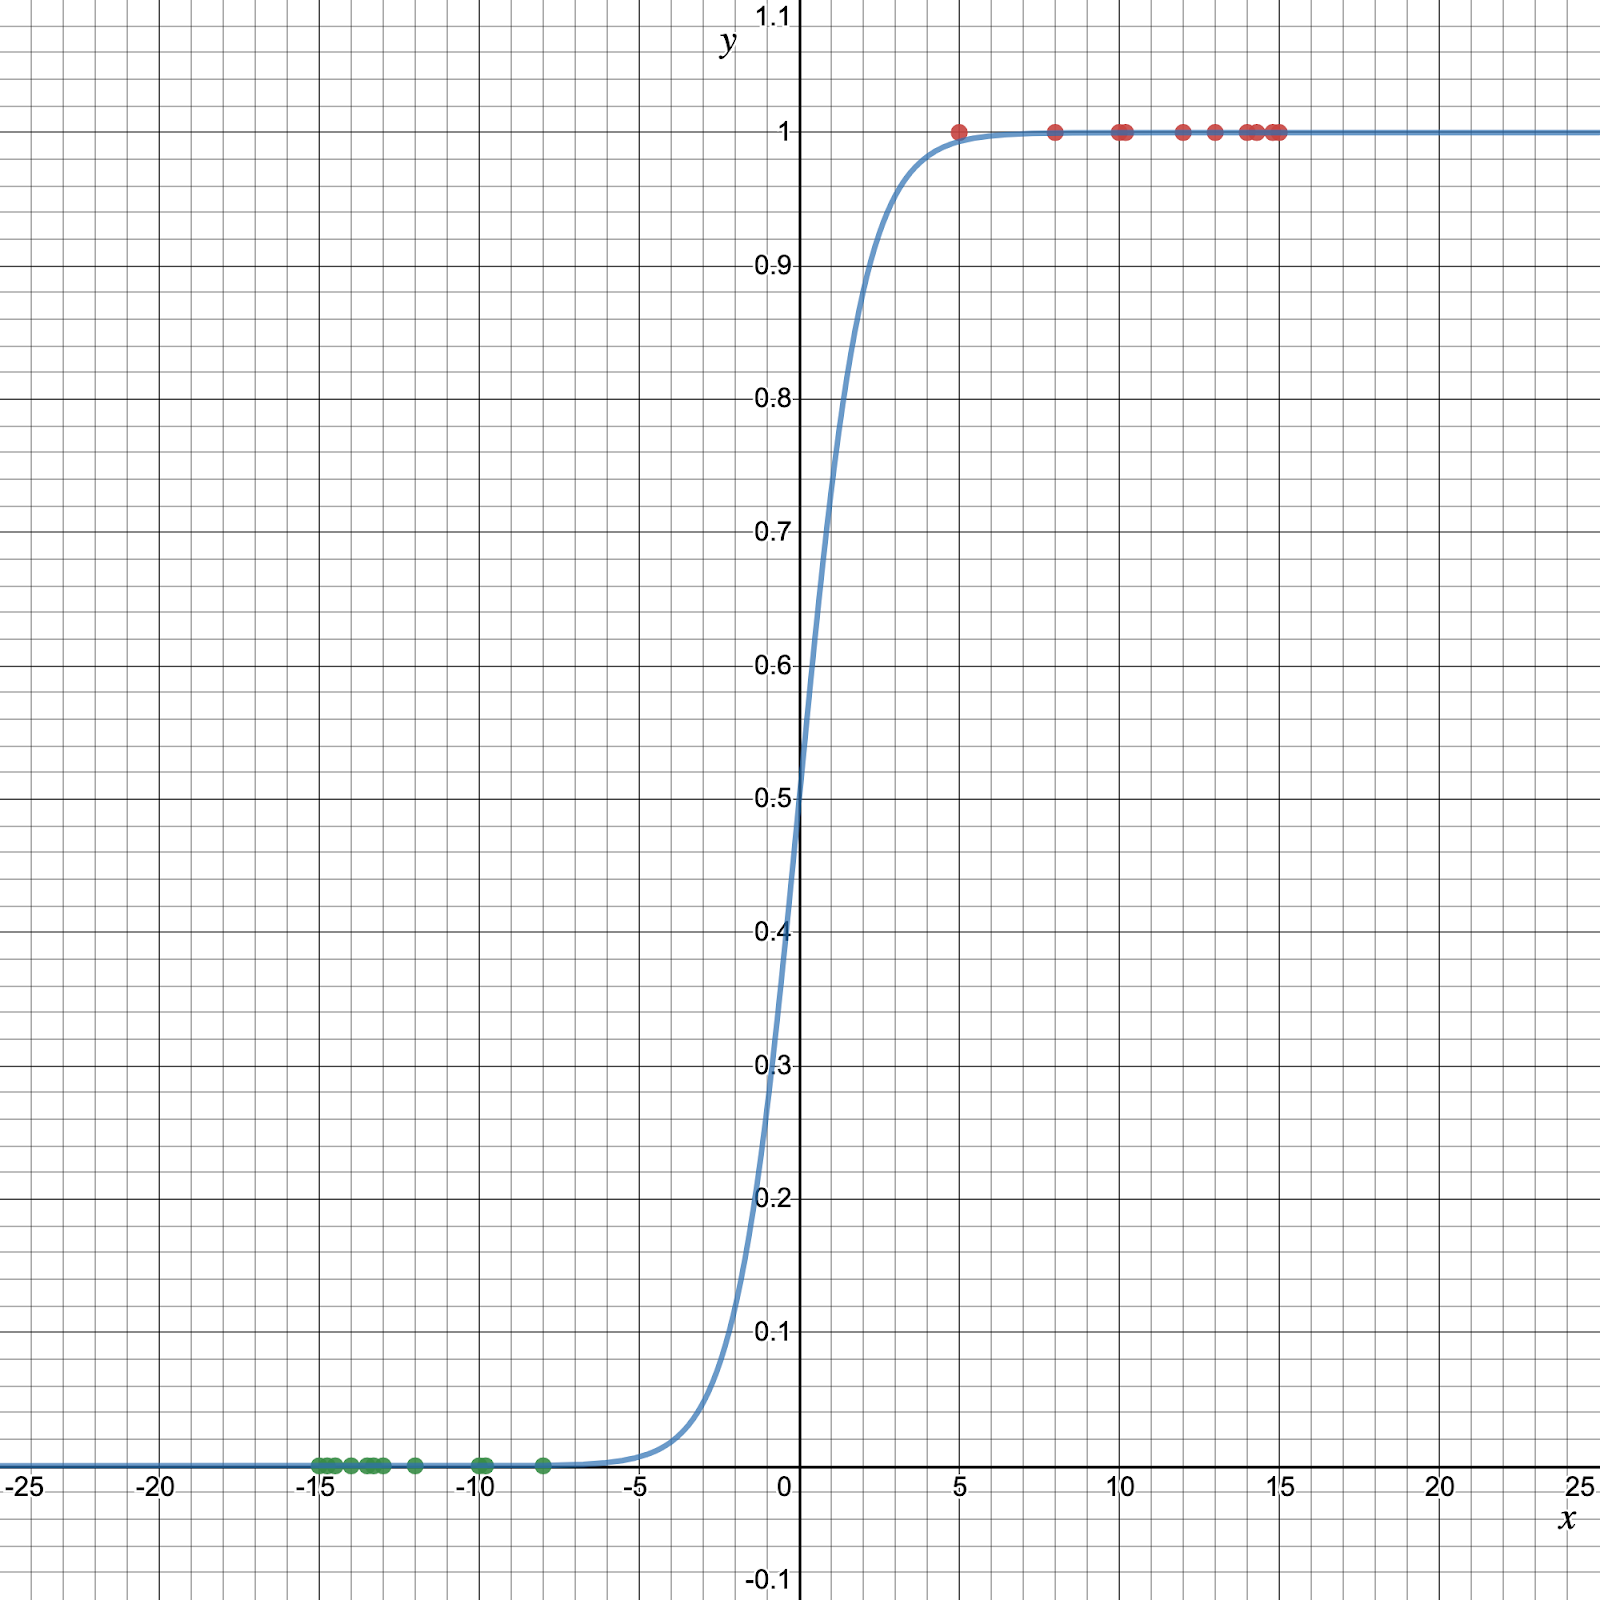
This gives a value y that is extremely close to 0 if xis a large negative value and close to 1 if x is a large positive value. After the input value has been squeezed towards 0 or 1, the input can be run through a typical linear function, but the inputs can now be put into distinct categories.
How Logistic Regression Is Used
It is important to understand that logistic regression should only be used when the target variables fall into discrete categories and that if there’s a range of continuous values the target value might be, logistic regression should not be used. Examples of situations you might use logistic regression in include:
- Predicting if an email is spam or not spam
- Whether a tumor is malignant or benign
- Whether a mushroom is poisonous or edible.
When using logistic regression, a threshold is usually specified that indicates at what value the example will be put into one class vs. the other class. In the spam classification task, a threshold of 0.5 might be set, which would cause an email with a 50% or greater probability of being spam to be classified as “spam” and any email with probability less than 50% classified as “not spam”.
Although logistic regression is best suited for instances of binary classification, it can be applied to multiclass classification problems, classification tasks with three or more classes. You accomplish this by applying a “one vs. all” strategy.
What's a "one vs. all strategy?" Let's say you have three different classes that instances in your dataset could fall into, and if you had these three classes you could treat them as three different binary classification problems.
For instance, you would train a classifier on just the examples belonging to Class A vs. all the examples belonging to all other classes. You would then do the same thing for Class B, and finally for Class C.
After the classifiers have learned to distinguish their chosen class from other classes, you just run the three classifiers on the inputs and whichever classifier is most confident it has chosen the correct class for that example, that is what class you put the example in.
Test Case In Applying Logistic Regression
Are you feeling like this has all been a bit theoretical thus far? One of the best ways to learn something is to see a real life example, so let’s take a look at an implementation of logistic regression on a real-world dataset.
A good dataset to practice with is the Breast Cancer Wisconsin Dataset. The dataset is split into 569 instances/examples with 32 different attributes/features.
The goal of classification with the dataset it to predict whether or not a tumor is likely cancerous or benign, and since there are only two categories this makes the classification task perfect for logistic regression.
We are going to be using the Breast Cancer Wisconsin dataset (available here) because there is very little preprocessing of the data needed (there are very few critical missing values, for example). Typically when you get a dataset you need to preprocess it to make it fit for a machine learning algorithm.
Logistic Regression In Python
We’ll be going over an example of implementing Logistic Regression in Python. If you are more acquainted with R there are documents covering the implementation of this algorithm in R as well.
First, we’ll start off by importing the required libraries.
We’re going to be using Scikit-learn, a machine learning library for Python. We’re also using the Pandas library to load in the CSV, and Numpy to convert the dataframe into arrays logistic regression can use.
import numpy as np
import pandas as pd

# Now load in the dataset with Pandas
dataset = pd.read_csv(‘data.csv')

# Print out part of the dataset to ensure proper loading
print(dataset.head())
We don't have to do a whole lot of preprocessing with this dataset, but one thing we may want to do is drop the column in the dataset which contains a bunch of unknown values.
df = df.drop('Unnamed: 32', axis=1)

print(df.head(5))
Now we need to split our dataframe into training and testing sections. It is important not to test on the same data you trained on, because this is extreme bias and it won’t accurately reflect what the classifier has managed to learn.
We can use the “train_test_split” function in Scikit-learn to split the data, and we specify what percentage of the data we would like to set aside for testing.
from sklearn.model_selection import train_test_split

X_train, X_test, y_train, y_test = train_test_split(x, y, test_size=0.15, random_state=31)
One thing we may want to do is rescale the features/inputs. Rescaling data brings values that may have extremely different ranges or units into alignment with one another. Bringing all the measurements into a similar scale helps the performance of the classifier (for a comparison try dropping the scaling and see how your performance decreases), and we can accomplish this with the StandardScaler from Scikit-Learn.
from sklearn.preprocessing import

StandardScaler


# Create an instance of the scaler and apply it to the data


sc = StandardScaler()

X_train = sc.fit_transform(X_train)

X_test = sc.transform(X_test)
Now that we’ve prepped the data, we can feed it into the logistic regression classifier. First, we’ll import the logistic regression algorithm from Scikit-learn.
from sklearn.linear_model import LogisticRegression
Now we will create an instance of the classifier and fit it to the training data.
LogReg_clf = LogisticRegression(random_state = 0)

classifier.fit(X_train, y_train)
We'll now create the predictions by running the classifier on the test dataset.
y_pred = classifier.predict(X_test)
Finally, let's check to see how the classifier performed by importing some metrics and checking the predicted values against the actual values.
from sklearn.metrics import confusion_matrix, accuracy_score


acc =  accuracy_score(y_test, y_pred)

cm = confusion_matrix(y_test, y_pred)


print(acc)

print(cm)
So there you go, your first Logistic Regression classifier in Scikit-learn!
Conclusion
Logistic regression is a powerful machine learning algorithm that utilizes a sigmoid function and works best on binary classification problems, although it can be used on multi-class classification problems through the “one vs. all” method. Logistic regression (despite its name) is not fit for regression tasks.
In order to take your understanding of logistic regression farther, it would be a good idea to try and apply it to other datasets, to see what kinds of classification problems it performs well at. You may also wish to continue reading about the probability theory behind the algorithm.
Eager to learn more about artificial intelligence topics like this one? Visit our blog at blog.kambria.io and click on "Tech" for a whole host of articles on AI, 3D Printing, Robotics, Blockchain and more. You can also visit kambria.io to learn more about our Open Innovation Ecosystem, which helps connect innovators and organizations. Let us know how you would like to get involved!
